Introduction
In recent decades, ecosystems in the low Arctic have seen an increase in average temperature, and this trend is expected to continue into the near future. The results of this increase for low Arctic ecosystems are vast and observed in several different ways, including longer and more severe forest fire seasons, permafrost thawing, and changes to vegetation (Symon et al. 2005).
Climate change is forecasted to change the ranges of numerous communities of vegetation by increasing the range of shrub species such as willow (Salix spp.), birch (Betula spp.), and alder (Alnus spp.). Shrub species are often the dominant vegetation cover observed using remote sensing, often forming dense clusters of vegetation that can be easily quantified (Olthof and Fraser 2014).
Experiments at Daring Lake, NT tested the effects of warming and fertilization, where deciduous shrubs showed increased growth rates to become the dominant cover.
In this study, we explore how remote sensing can be utilized to categorize and quantify the "shrubification" observed in the Canadian low Arctic, particularly in areas adjacent to the tree line.
The Science: Remote Sensing & NDVI
Remote sensing collects imagery to gain insight into large-scale patterns of landcover. Through the process of photosynthesis, living green plants absorb solar radiation in the photosynthetically active radiation (PAR) spectrum. However, they reflect solar radiation in the near-infrared (NIR) spectrum to avoid overheating.
Therefore, live green plants appear relatively bright in the NIR and dark in PAR. This contrast allows satellites like Landsat to calculate the Normalized Difference Vegetation Index (NDVI), a key metric for monitoring vegetation health and density over time.
Study Area & Methods
This study looked at an area (40,000 km²) adjacent to the Daring Lake Tundra Ecosystem Research Station (TERS) located at 111°35′W 64°52′N. TERS is approximately 50 km north of the tree line.
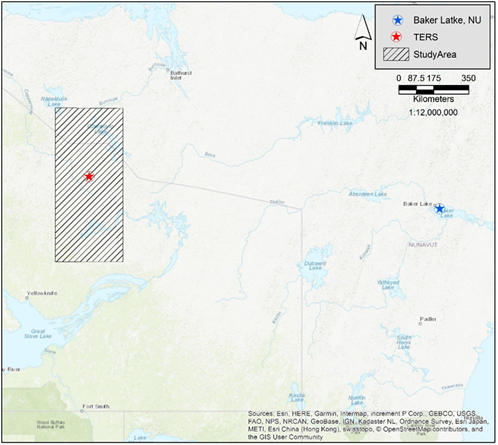
Temperature data was downloaded from Environment and Climate Change Canada for the weather station at Baker Lake, Nunavut. A global data set of Vegetation Index and Phenology data was retrieved courtesy of NASA.
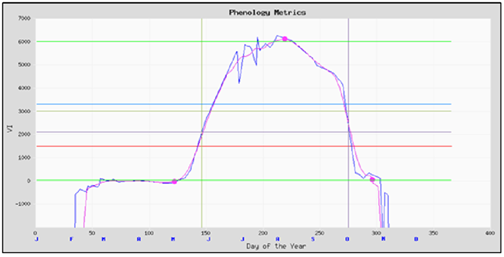
The start and end of the growing season are defined as five days of increasing or decreasing NDVI, respectively.
Results
The data analysis revealed significant trends over the 28-year period (1981-2008). Below is the complete dataset utilized for the analysis, followed by graphical representations of the trends.
| Year | Baker Lake Avg Temp (°C) | Start of Season | End of Season |
|---|---|---|---|
| 1981 | -10.0 | 11-Jun | 27-Sep |
| 2008 | -11.0 | 04-Jun | 14-Oct |
Discussion
Weather data from Baker Lake, NU showed an average increase of 0.07°C per year over the study period (1981-2008), totaling a two-degree increase. This result was as expected, consistent with numerous studies published in the Arctic Climate Impact Assessment (2005). The statistical analysis of the linear regression showed a weak correlation to the trend line ($R^2=0.18$, $p=0.023$). This weak correlation is likely a result of variations in local weather phenomena as well as a relatively short study period.
The average Start of the Growing Season for the study area showed a strong negative trend ($R^2=0.81$, $p < 0.001$). Over the 28 years, the start of season date shifted earlier by seven days (from June 11 in 1981 to June 4 in 2008).
The End of Season data showed a strong positive trend ($R^2=0.72$, $p < 0.001$), meaning the season is ending later. These results are consistent with studies published by Xu et al. (2013).
The cumulative effect of this observed change to ecosystems in the low Arctic can have far-reaching implications for various natural cycles (carbon cycle, water cycle, albedo effect, snow depths). Climate change models will require more accurate information about vegetation structure and extent in the changing low Arctic (Martin et al. 2017).
Literature Cited
- Didan, K. and A. Barreto. 2016. NASA measures vegetation index and phenology (VIP) phenology NDVI yearly global 0.05Deg CMG. NASA EOSDIS Land Processes DAAC.
- Symon, C., L. Arris, and B. Heal, editors. 2005. Arctic climate impact assessment. Cambridge University Press, New York, NY, USA.
- Xu L., et al. 2013. Temperature and vegetation seasonality diminishment over northern lands. Nature Climate Change 3:581-6